Trading Candlestick Patterns for Beginners: 5 Essential Reversal Setups
Japanese candlesticks emerged back in the 18th century when Japanese rice traders used them to forecast prices. Today, candlestick analysis remains one of the most popular technical analysis methods among traders worldwide. And for good reason: candlestick patterns help you spot market sentiment shifts before indicators catch up.
In this article, we’ll break down the 5 most reliable candlestick patterns that’ll help beginner traders find reversal points in crypto, forex, and index markets. Each pattern will be thoroughly explained with real trading examples.
Why Candlestick Analysis Still Works in the 21st Century
Many new traders wonder: how can patterns invented 300 years ago still work today? The answer’s simple — human psychology hasn’t changed. Fear and greed drove markets then, and they drive them now.
Every candle on your chart tells a story of the battle between buyers and sellers. The candle’s shape shows who won and how convincingly. When these “stories” form certain combinations, they often predict what’s coming next.
Here’s the key: a candle consists of a body (the difference between open and close) and wicks (the period’s extremes). A green candle means buyers won, a red one means sellers were stronger.
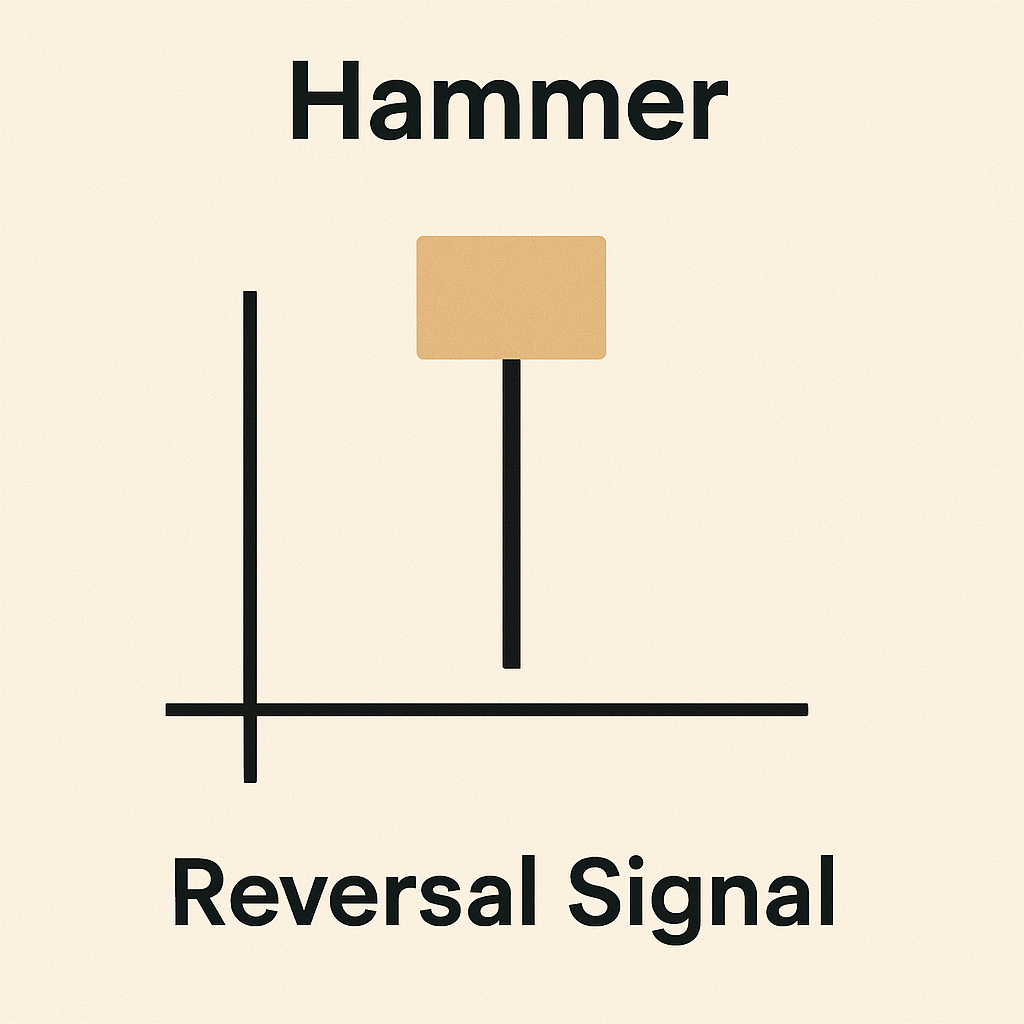
Pattern #1: The Hammer — Your Bottom Reversal Signal
Picture this: Bitcoin’s been falling for a week straight, traders are panic-selling, but suddenly a candle appears with a small body at the top and a long lower wick. That’s a hammer — one of the most reliable reversal signals out there.
A hammer forms when sellers push the price down hard, but buyers find the strength to bring it back near the opening level. The long lower wick (at least twice the body’s length) shows bulls are starting to take control.
Real-world example: In March 2024, BTC/USDT pulled back from around $71,000 to nearly $63,000. A classic hammer formed on the daily chart. Traders who spotted the pattern entered long positions before the bounce back toward $69,000–71,000.
Pro tip: When this same candle appears at the top of an uptrend, it’s called a “hanging man” and signals a potential drop. Context is everything.
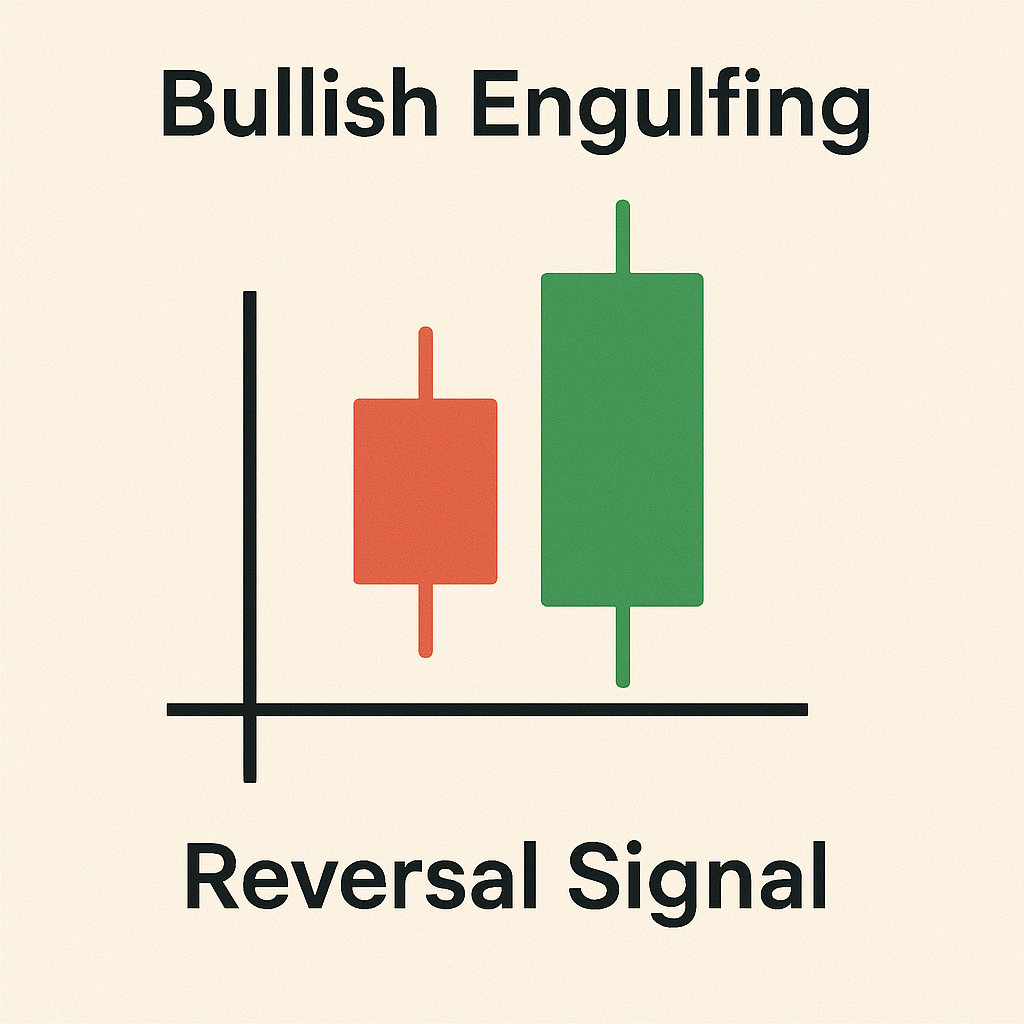
Pattern #2: Engulfing — When One Side Completely Dominates
A bullish engulfing is a two-candle pattern where the second candle completely “swallows” the first. After a series of red candles, a small red appears, followed by a large green that opens below the first candle’s close and closes above its open.
The psychology’s straightforward: sellers are exhausted, and buyers don’t just stop the decline — they reverse the market with such force that they completely override the previous drop.
Here’s how it looks in practice: EUR/USD drops from 1.1200 to 1.1000. A bullish engulfing forms at the bottom. A trader enters long at the second candle’s close with a stop below the pattern’s low. The target? At least the pattern’s height upward.
Bearish engulfing works the same way but in reverse at uptrend tops.
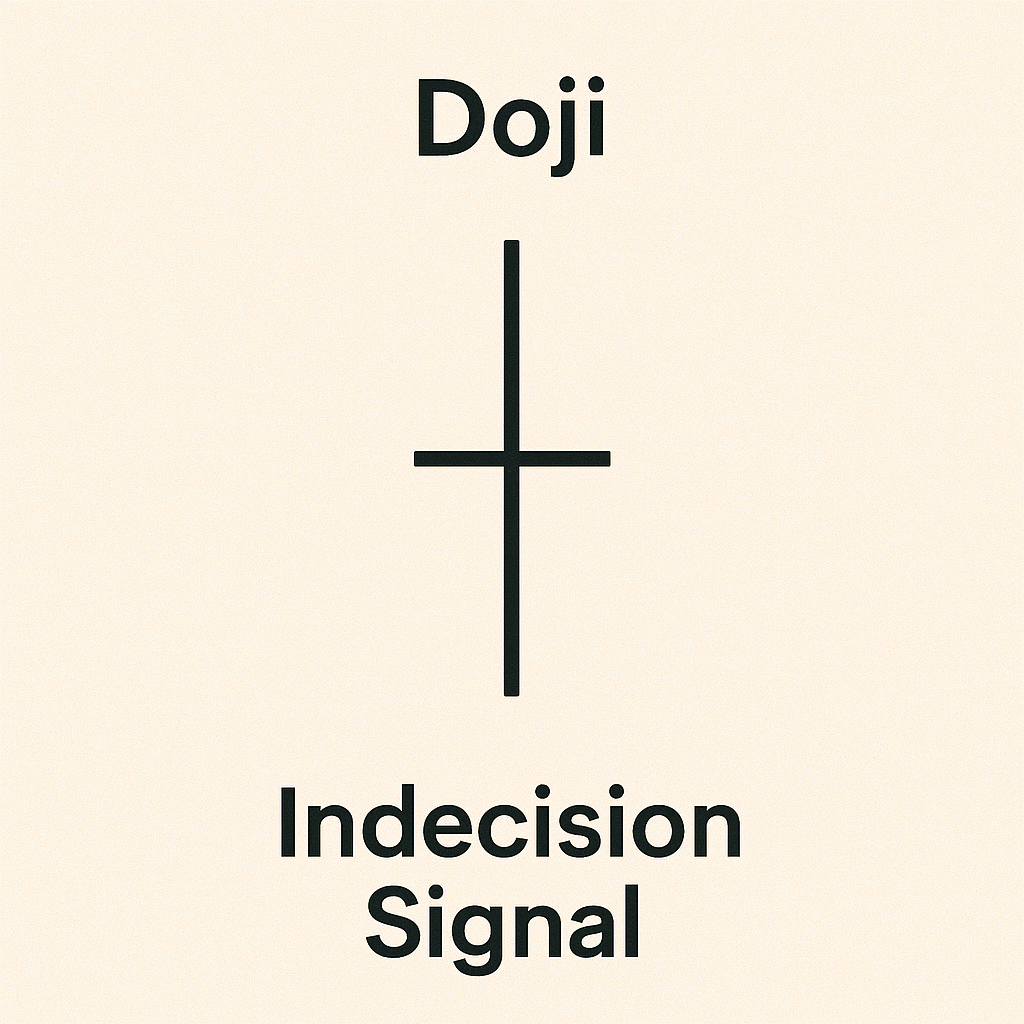
Pattern #3: Doji — When the Market Can’t Decide
A doji looks like a cross: the open equals the close. This shows complete market indecision — neither bulls nor bears could claim victory.
By itself, a doji is neutral, but in a trending context, it becomes a powerful signal. After a strong rally, a doji often warns of a reversal down; after a selloff, it hints at a possible bounce.
Index trading example: The S&P 500 rallies for 5 straight days, gaining 200 points. On day six, a doji forms with a long upper wick (gravestone). The next candle’s red. That’s a textbook short signal.
There are several doji types: standard (equal wicks), dragonfly (long lower wick — bullish signal), gravestone (long upper wick — bearish signal). Each has its quirks, but the principle’s the same — the market’s reached a balance point.
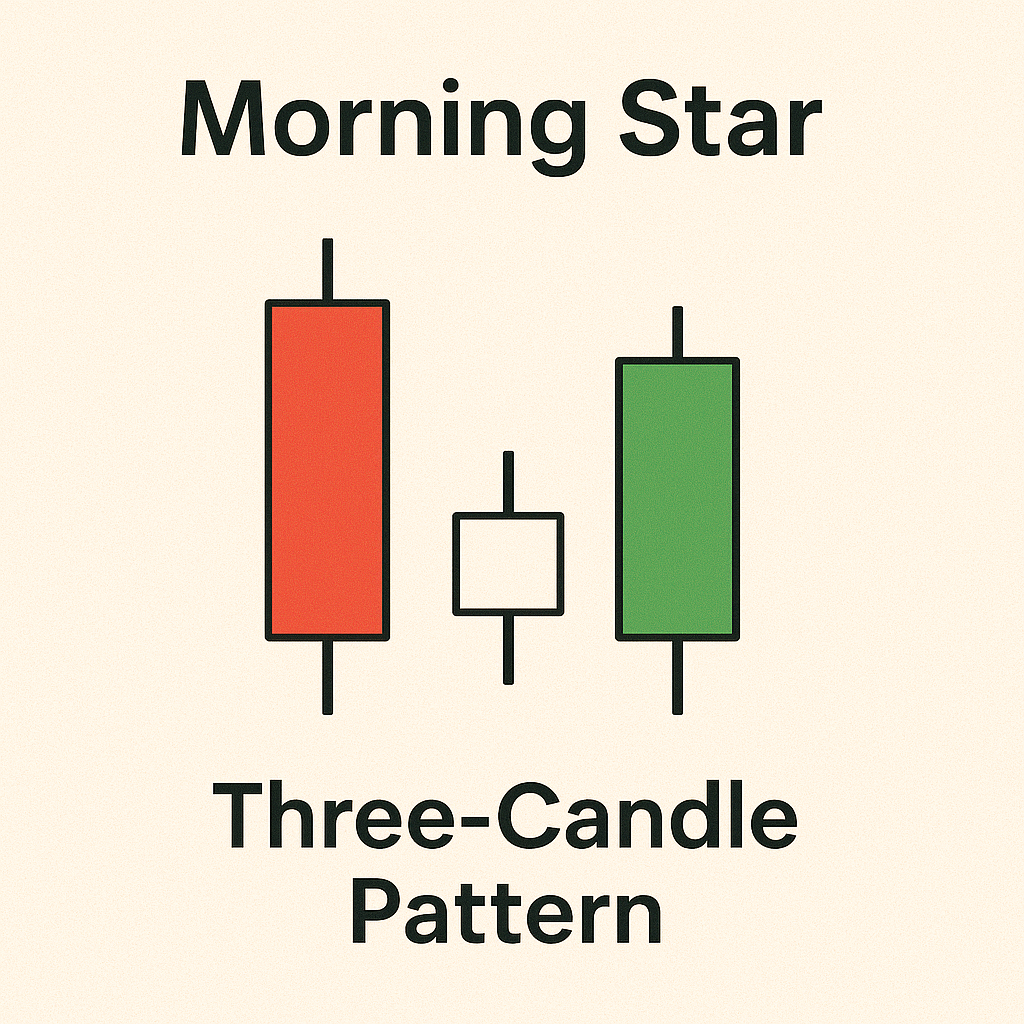
Pattern #4: Morning Star — A Three-Candle Hope Formation
The morning star is a three-candle pattern that forms at downtrend bottoms. First candle — large and red (continuing the drop), second — small of any color with a gap down (slowing decline), third — large and green (reversal).
The pattern’s name is both poetic and accurate: just as the morning star heralds dawn, this pattern signals the end of an asset’s “dark times.”
Real case: Ethereum drops from $3,000 to $2,500. A morning star forms at the bottom. Experienced traders go long at the third candle’s close. Stop goes below the middle candle’s low. In the following days, ETH recovers to $2,800.
The evening star is the mirror pattern for tops. Works just as reliably, but in the opposite direction.
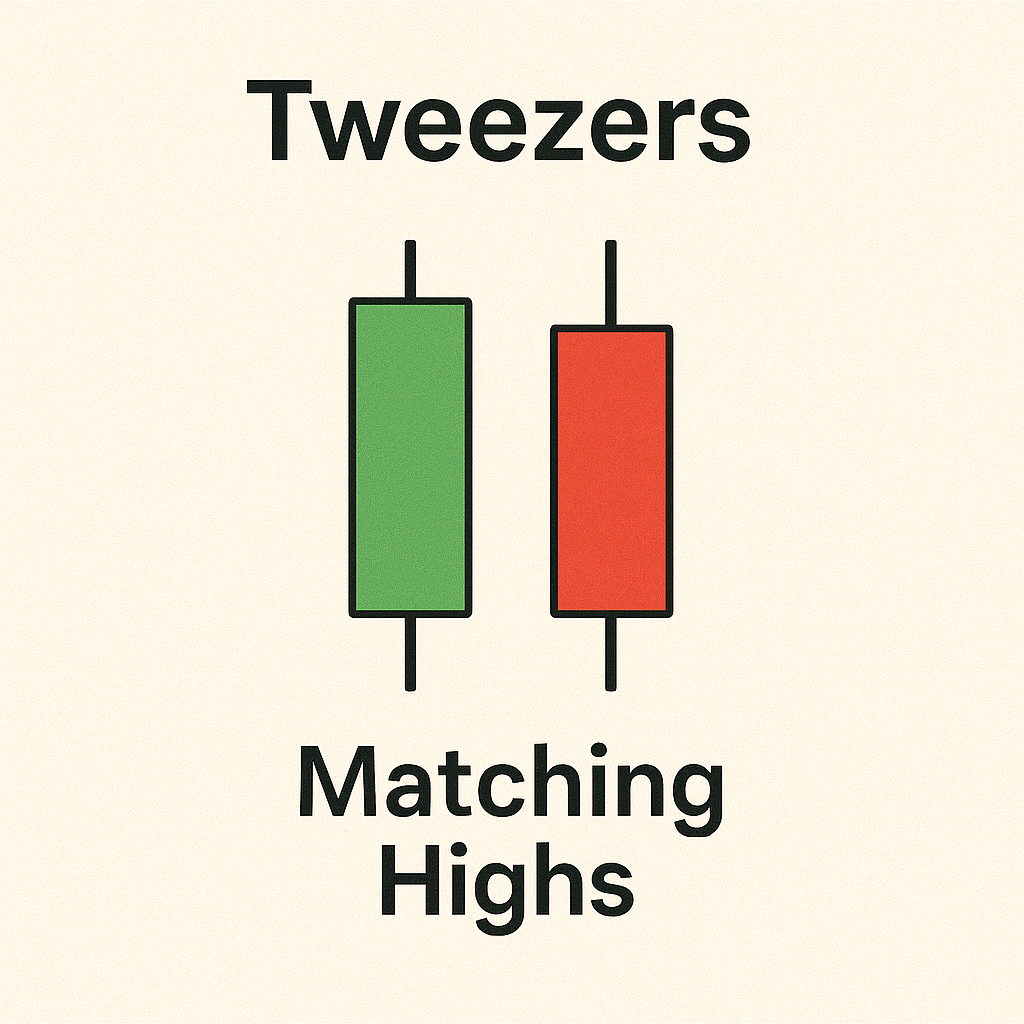
Pattern #5: Tweezers — Double-Testing the Level
Tweezers form when two or more candles have identical highs or lows. At a trend bottom — matching lows (bullish tweezers), at a top — matching highs (bearish tweezers).
The pattern’s logic: the market tests a level twice and can’t break through. This creates strong support or resistance that often triggers a reversal.
Real scenario: GBP/USD rallies toward the psychological 1.3000 level. The pair touches this level twice but can’t close above. Bearish tweezers form. Traders open shorts with tight stops above 1.3000.
The more touches of the level, the stronger the signal. Triple or quadruple tweezers are exceptionally reliable patterns.
How to Trade Candlestick Patterns the Right Way
Knowing patterns is only half the battle. What matters is using them correctly. Here’s a step-by-step guide for beginners:
Step 1: Identify the current trend. Reversal patterns only work after a clear move. No trend means no reversal.
Step 2: Wait for the pattern to complete. Don’t try to guess — candles can change before closing.
Step 3: Look for confirmation. After the pattern, you need a candle confirming the reversal. For bullish patterns — green, for bearish — red.
Step 4: Check the context. Patterns near strong support/resistance levels work better than those in “no man’s land.”
Step 5: Enter with a clear plan. Stop-losses are mandatory. For most patterns, place them beyond the formation’s extreme.
Common Mistakes When Trading Candlestick Patterns
New traders tend to make the same mistakes. Let’s cover the most common ones:
Mistake #1: Seeing patterns everywhere. Not every candle with a long wick is a hammer. Not every two candles are an engulfing. Patterns must meet all criteria.
Mistake #2: Ignoring the big picture. A hammer in the middle of sideways action isn’t a signal. Patterns work in trending contexts.
Mistake #3: Rushing entries. Saw a hammer — immediately long. That’s wrong. Wait for the confirming candle.
Mistake #4: Forgetting risk management. Even the prettiest pattern can fail. Stop-losses are always mandatory.
Mistake #5: Using tiny timeframes. One-minute charts have too much noise. Start with H4 or daily — patterns are more reliable there.
Practical Tips for Mastering Candlestick Analysis
Theory without practice is dead. Here’s how to effectively master pattern trading:
Tip 1: Start with one pattern. Pick the hammer, for instance, and trade only it for a month. Once you’ve mastered it, add the next one.
Tip 2: Keep a trading journal. Record every pattern: where you spotted it, whether it worked, what you could’ve done better. After a month, you’ll see your weak spots.
Tip 3: Use a demo account. Don’t risk real money until you can consistently find and trade patterns profitably.
Tip 4: Combine with other tools. Pattern + level + RSI at extremes = strong signal. Don’t rely on candles alone.
Tip 5: Be patient. Quality patterns don’t appear daily. Better to skip a questionable signal than jump into everything.
Conclusion: Candlestick Patterns as Your Technical Analysis Foundation
Candlestick patterns are the universal language of markets, understood by traders worldwide. They work across all markets and timeframes, from crypto to stock indices, from minute to monthly charts.
The five patterns in this article — hammer, engulfing, doji, morning star, and tweezers — are the foundation every beginner should start with. Master these, and you’ll read charts like a book, seeing not just price movement but the emotions and intentions of market participants.
Remember: successful trading isn’t about finding a magic formula, it’s about continuous learning, practice, and discipline. Candlestick patterns are an excellent tool in a trader’s arsenal, but they require understanding context, patience, and proper risk management.
Start by studying these five patterns, practice them on a demo account, and only then move to live trading. And remember the golden rule: it’s better to miss ten questionable signals than enter one bad trade.
Good luck with your trading, and may the candles always point you in the right direction!
Risk Warning: Trading financial markets carries the risk of loss. Past performance doesn’t guarantee future profits. Always use stop-losses and never risk money you can’t afford to lose.
👉 Start now at Catchline.io