Catchline’s Secret Weapon That Shows Where Smart Money Is Moving
Imagine walking into a casino and seeing which roulette numbers everyone else is betting on. Or playing poker while knowing your opponents’ cards. That’s exactly the edge the “Trader Sentiment” indicator gives you on the Catchline platform — you see how the majority is trading and can use this information to make more informed decisions.
What Is “Trader Sentiment” and Why It Matters
There’s an old trading saying: “The market is always right.” But what if we told you it’s sometimes useful to know when the market is about to be wrong? The Trader Sentiment indicator is a unique tool that shows in real-time how most market participants are positioned on each asset.
Where to Find This Indicator
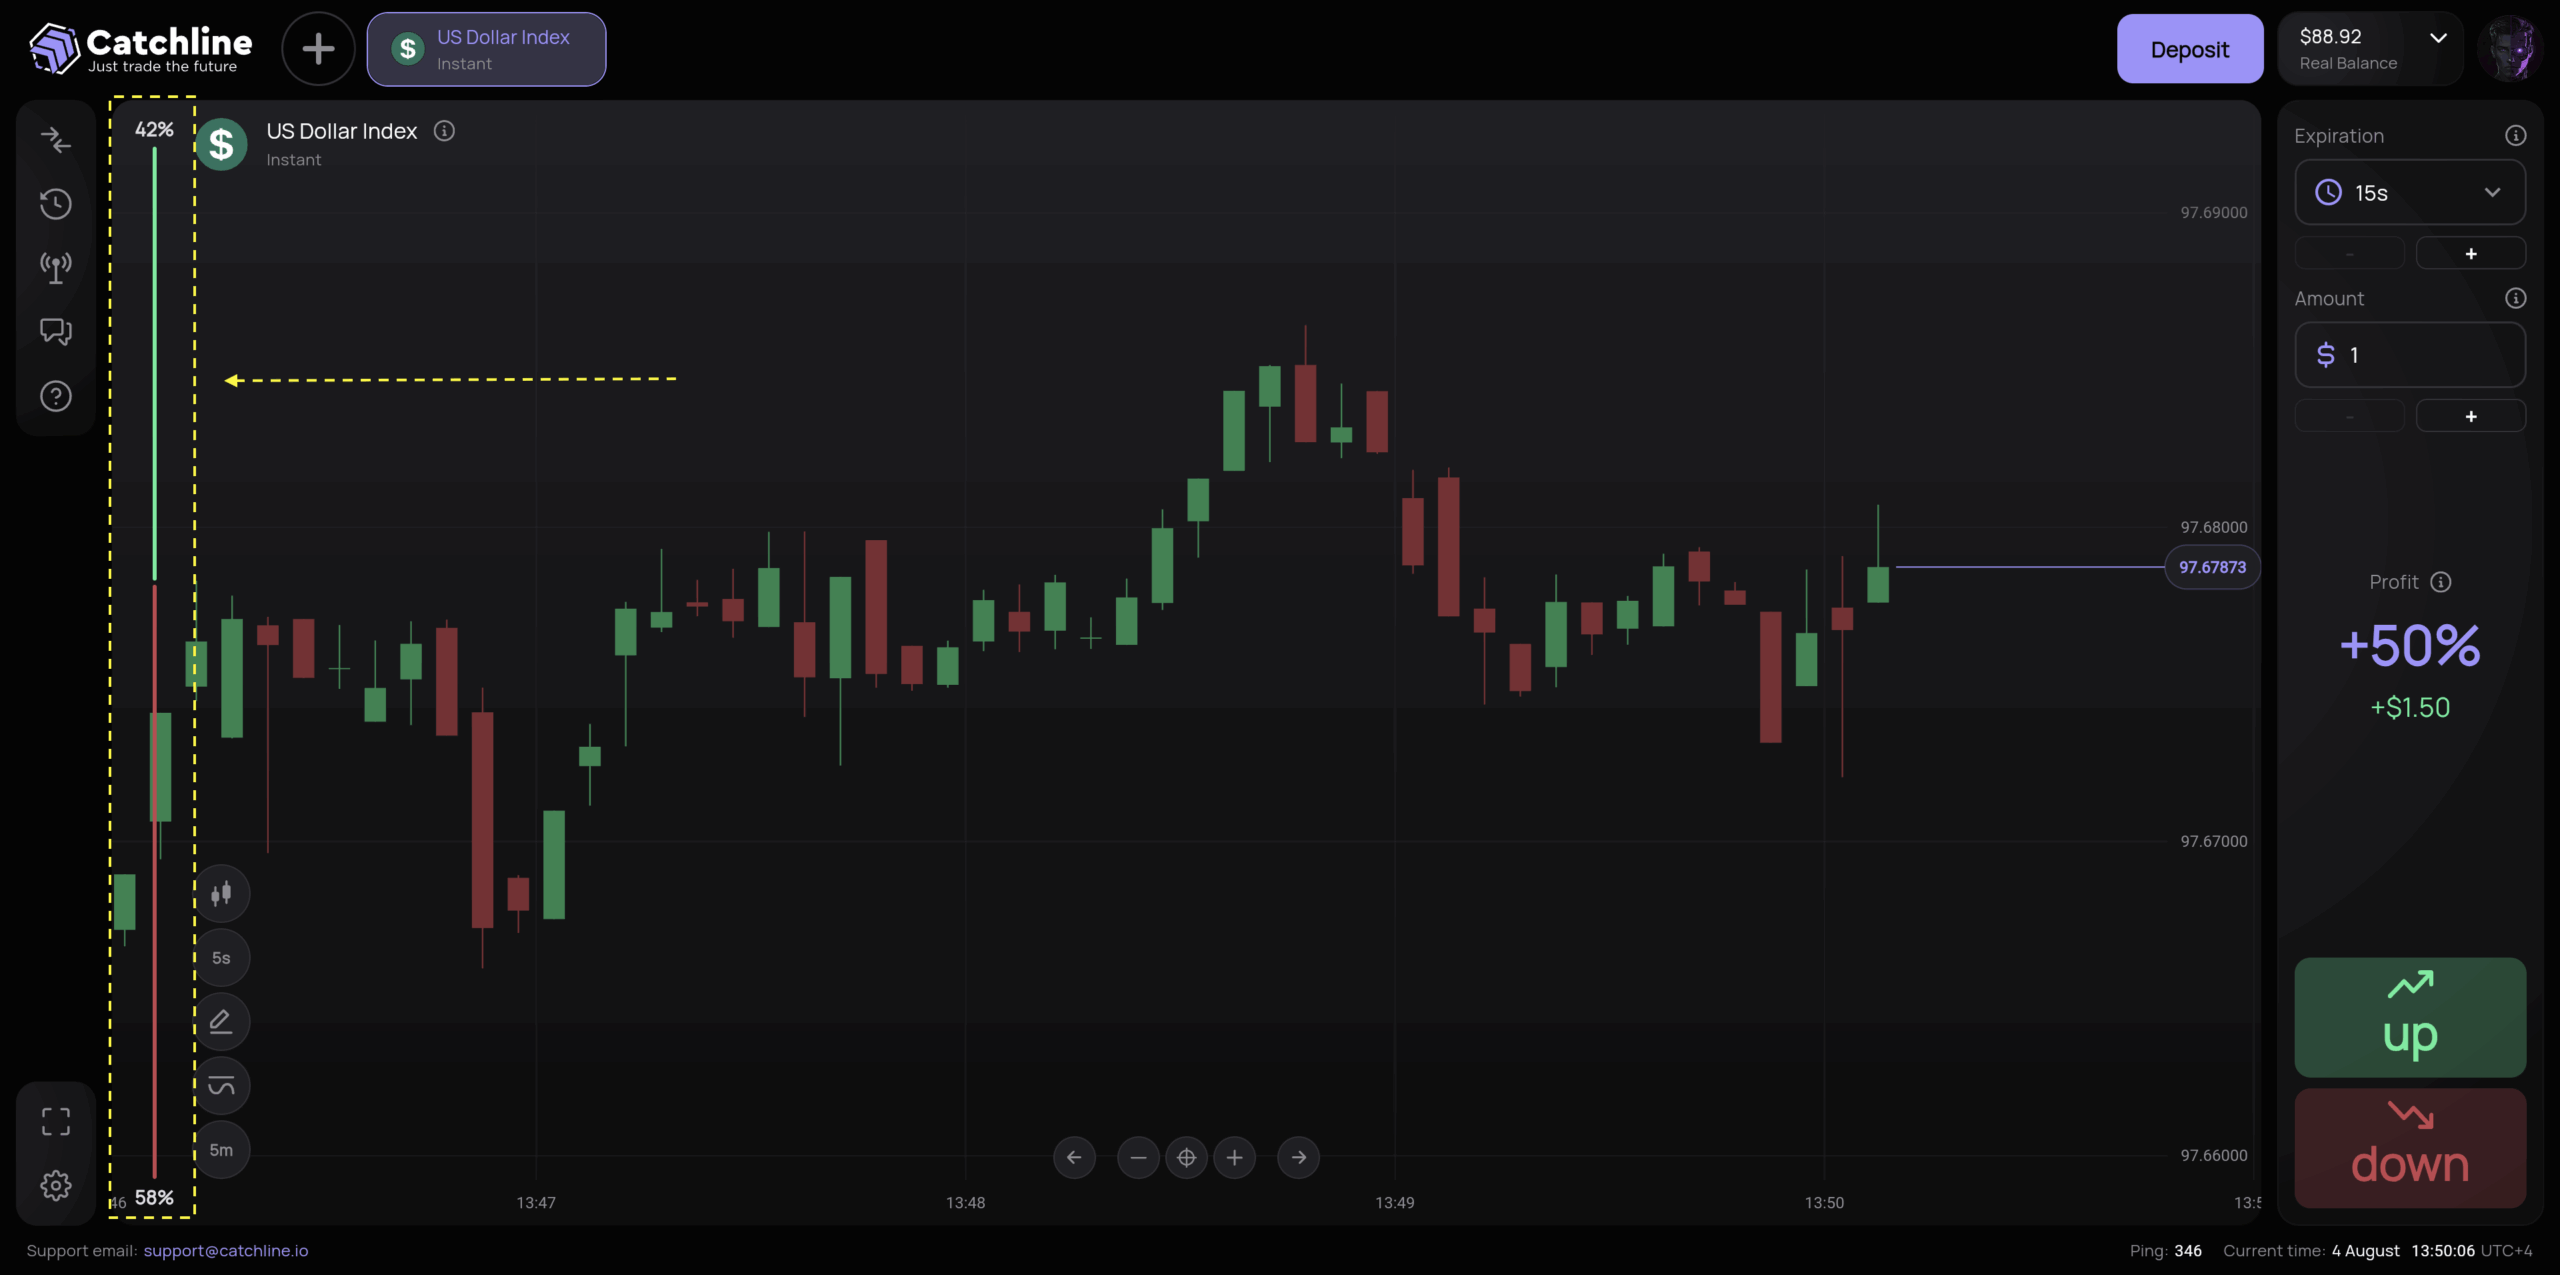
On the Catchline platform, the sentiment indicator is located in the side panel next to each trading asset. It’s an intuitive visualization that instantly gives you a read on market sentiment.
How to Read the Indicator: Simple Color Coding
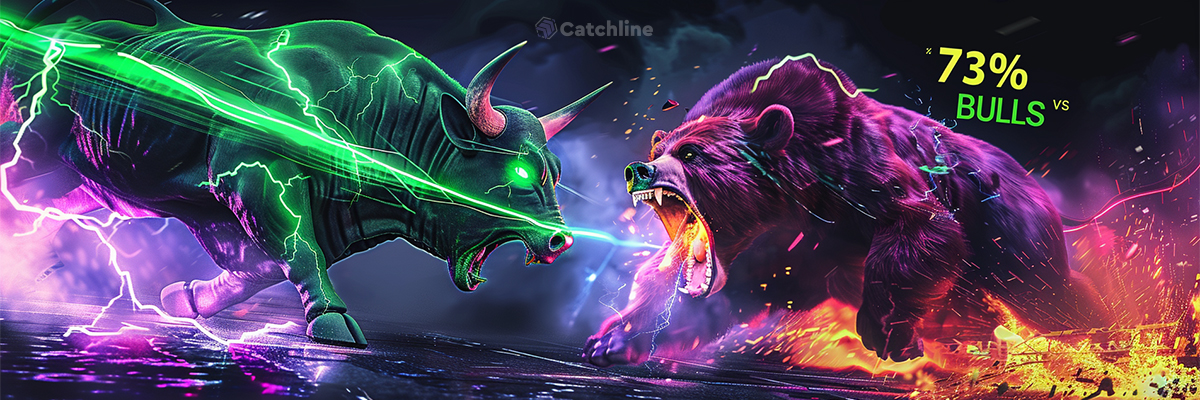
🔴 Red = Bearish Sentiment
When the indicator shows red, it means most traders are betting on the asset falling. The percentage displayed — for example, “73% ↓” — means 73% of traders have opened positions expecting a decline.
🟢 Green = Bullish Sentiment
Green signals that buyers dominate. A reading of “68% ↑” tells you that 68% of market participants expect the price to rise.
⚪ Neutral Zone (45-55%)
When opinions are split roughly evenly, the indicator shows a balance of power. This often happens before major news releases or during periods of uncertainty.
Crowd Psychology: Why This Works
The Herd Instinct Phenomenon
Humans are hardwired to follow the majority — it’s an evolutionary survival mechanism. In trading, this manifests particularly clearly:
- During strong trends most join the movement
- At extremes the crowd is often wrong
- In moments of panic emotions override logic
Smart Money vs. The Crowd
Experienced traders know: when 90% of market participants are looking in one direction, a reversal is often approaching. Why? Because:
- Everyone who wanted to buy has already bought — no one left to push prices higher
- Profit-taking begins — the first smart money starts exiting
- Contrarian players — enter against the crowd
Strategies for Using the Sentiment Indicator
Strategy #1: “Follow the Trend”
For beginner traders
When to use:
- Sentiment shows 60-75% in one direction
- Clear trend visible on the chart
- No major news in the coming hours
How to trade:
- Wait for sentiment to reach 65% in one direction
- Confirm the trend on the chart
- Open a position in the direction of the majority
Example: EUR/USD shows 67% buyers, chart has been rising for 2 hours. Open an UP position with 15-30 minute expiration.
Strategy #2: “Contrarian Reversal”
For experienced traders
Entry signals:
- Extreme readings (>85% or <15%)
- Divergence with price chart
- Overbought/oversold indicators
The logic: When 90% of traders are buying, the market is often ready for a correction. This is the classic “everyone’s already in” situation.
Entry rules:
- Wait for extreme sentiment readings (>85%)
- Look for signs of trend weakening
- Open position against the crowd
- Use short expiration (5-15 minutes)
Strategy #3: “Balance of Power”
Universal strategy
Conditions:
- Sentiment in 45-55% range
- Flat or narrow range on chart
- Awaiting important news
Tactics: During uncertainty, it’s best to stay out or use range-trading strategies.
Real Trading Case Studies
Case 1: “Bitcoin Euphoria”
Situation: BTC/USD breaks all-time high, sentiment shows 92% buyers.
Action: Experienced trader Rodrigo opened a short position.
Result: After 20 minutes, a 3% correction began, position closed with profit.
Lesson: Extreme greed often precedes corrections.
Case 2: “LatAm FX Index Panic”
Situation: Negative geopolitical news caused a sharp drop in the LatAm FX Index, and the sentiment indicator showed an extreme bearish reading, signaling that most traders were in a state of panic.
Action: A savvy trader waited for the sentiment to reach its peak extreme and opened an UP position, predicting a rebound.
Result: A strong bounce from the low point led to a very profitable trade.
Lesson: Panic creates unique opportunities for contrarian predictions.
Combining with Other Catchline Tools
🎯 Sentiment + Trading Signals
When signals align with sentiment:
- UP signal + 70% buyers = reinforced signal
- DOWN signal + 80% buyers = potential reversal
📊 Sentiment + Technical Analysis
Use sentiment for confirmation:
- Resistance breakout + rising bullish sentiment = strong signal
- Support test + extreme pessimism = bounce opportunity
⏰ Sentiment + Time of Day
Consider temporal patterns:
- London open — sharp sentiment shifts
- Session overlaps — maximum indicator volatility
- Asian session — more stable readings
Psychological Traps and How to Avoid Them
Trap #1: “Blind Crowd Following”
Problem: Beginners often think the majority is always right.
Solution: Use sentiment as one factor, not the sole criterion.
Trap #2: “Premature Contrarianism”
Problem: Trying to catch reversals at 70% can be too early.
Solution: Wait for extreme readings (>85%) and chart confirmation.
Trap #3: “Ignoring Context”
Problem: 90% sentiment can persist for hours during strong trends.
Solution: Always consider fundamentals and news background.
Advanced Sentiment Techniques
“Sentiment Divergence”
Watch for discrepancies between:
- Sentiment and price
- Sentiment across timeframes
- Sentiment on correlated assets
“Cluster Analysis”
Compare sentiment across asset groups:
- All USD currency pairs
- Cryptocurrencies as a class
“Temporal Patterns”
Keep statistics on:
- What times of day sentiment is most often wrong
- How accuracy changes on different weekdays
- Seasonal peculiarities
FAQ: Frequently Asked Questions
Q: Does the indicator update in real-time?
A: Yes, data refreshes every second, reflecting current position distribution.
Q: Are position sizes considered or just trader count?
A: The current version counts traders. This gives a more honest picture of market sentiment.
Q: Can I see historical sentiment changes?
A: A historical sentiment chart feature is in development.
Performance Statistics
According to Catchline’s internal analytics:
- Trend-following strategy at 65-75% sentiment shows 68% winning trades
- Contrarian strategy at >85% extremes yields 73% profitable entries
- Combining with signals improves accuracy by 15-20%
The Future of Sentiment Indicator
The Catchline team is working on enhancements:
- Machine Learning predictions of sentiment changes
- Alerts when extreme values are reached
- Historical charts for pattern analysis
- API for algo trading based on sentiment
Conclusion: Your Window into Market’s Collective Mind
The Trader Sentiment indicator isn’t a crystal ball predicting the future. It’s a tool that gives you an informational edge. Knowing how the majority is positioned, you can:
- Confirm your trading ideas
- Find reversal points
- Avoid crowd traps
- Increase your probability of successful trades
Remember: in trading, the winner isn’t the one who follows the crowd, but the one who understands its behavior and uses this knowledge wisely.
Start using the Trader Sentiment indicator today. Observe, analyze, and let the market’s collective intelligence work for your profit. Catchline — where information becomes advantage.
👉 Start now at Catchline.io